Home irrigation system for potted plants

Summer in my neck of the woods (29S, 54W, a mere 50m above sea level) is brutal; temperatures can reach above 30ºC during the day, and stay above 20ºC at night. Under these conditions, potted plants such as shubs, herbs and ivies need to be watered every day to stay healthy. That is a chore, and more complicated if one goes away for a few days. What’s a geek to do? Why, build an IoT irrigation system!

Sourcing the parts

The system is comprised of a kit of tubing, drippers, support stakes and T connectors. To drive the water a small pump was selected, and finally a WiFi relay will allow some degree of smart control.  Here are the parts:

Irrigation kit

Link SKU 32868257464
Price $13.31
Variant 25m Kit / 30pcs

kit_irrigacao

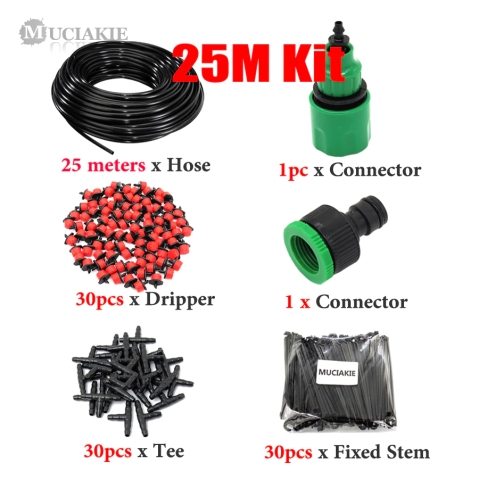
With this kit, you route the black tubing around the area you want to irrigate, and then at each target you cut the hose, insert a “T” and derive a short run of hose ending on a dripper, supported by a stem. The drippers can have their flow adjusted by twisting the cap.

Water pump

The selected pump is a small submersible DC brushless pump, of the type that is commonly used in arts and crafts to make little fountain ornaments.

Link SKU 32792939616
Price $3.46

water_pumpjpg

This pump runs on 12V DC, and to power it I used a DC adapter I had lying around, for which I have no link or reference. Given the small wattage of the pump, almost any 12V power adapter will do.
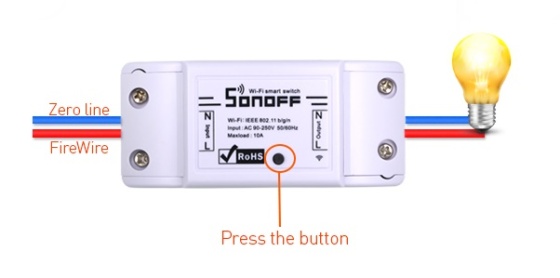
WiFi Relay

The last piece of the puzzle is to add something to turn the pump on and off periodically; a simple programmable would work, but a WiFi relay is more versatile, and can later be integrated in my home automation hub.


Link SKU 32827328525
Price $4.97
Controlling app eWeLink – Smart Home Control

This is a SONOFF device from Itead (see https://www.itead.cc/). They have a variety of different IoT modules with interesting applications. This Sonoff relay (and most of their devices) is based around the valiant ESP8266 and the fact that it adds its own mains power supply, a relay, connectors and a very neat enclosure, make it a very interesting device to work with.

sonoff

The app used to program and control the relay (eWeLink) is not bad at all, but in order to have more flexibility in connecting it to my own home-automation hub, I’m probably going to re-flash it with an alternative firmware.  There are a few options for these Sonoff devices, but the most mature and feature-complete one seems to be the Espurna firmware (https://github.com/xoseperez/espurna). More on that on another post.

Measuring the flow rate of the water pump

The water pump is rated for 240 liters of water per our of operation, or 4 liters per minute if you do the math. I wanted to test this out, and it turned out close: on my tests, I’ve got 3.5 liters per minute, or 210 liters per hour. More than enough for my application, although this was measured with a short tube on the output, the actual flow will probably be less, when coupled with the long hose and several drippers.

Putting it all together

Not much to say about that, you just connect the pump to the power adapter, that into the WiFi relay and the relay to mains. For water supply I used a 20l water jug, on which I added a small output valve near the bottom line.

Here are a few pictures of the setup on its “inaugural run”, on 2018-12-16:

Photo 2018-12-16, 18 16 01The pieces all connected together, except for the water hoses.

Photo 2018-12-16, 19 16 58
On the wall, with hoses connected, and with the 20l “tank”, ready for first tests.

Photo 2018-12-16, 19 09 45The main water line running horizontally throughout the balcony, and a “T” derivation feeding a dripper for a potted plant.

Photo 2018-12-16, 19 13 50
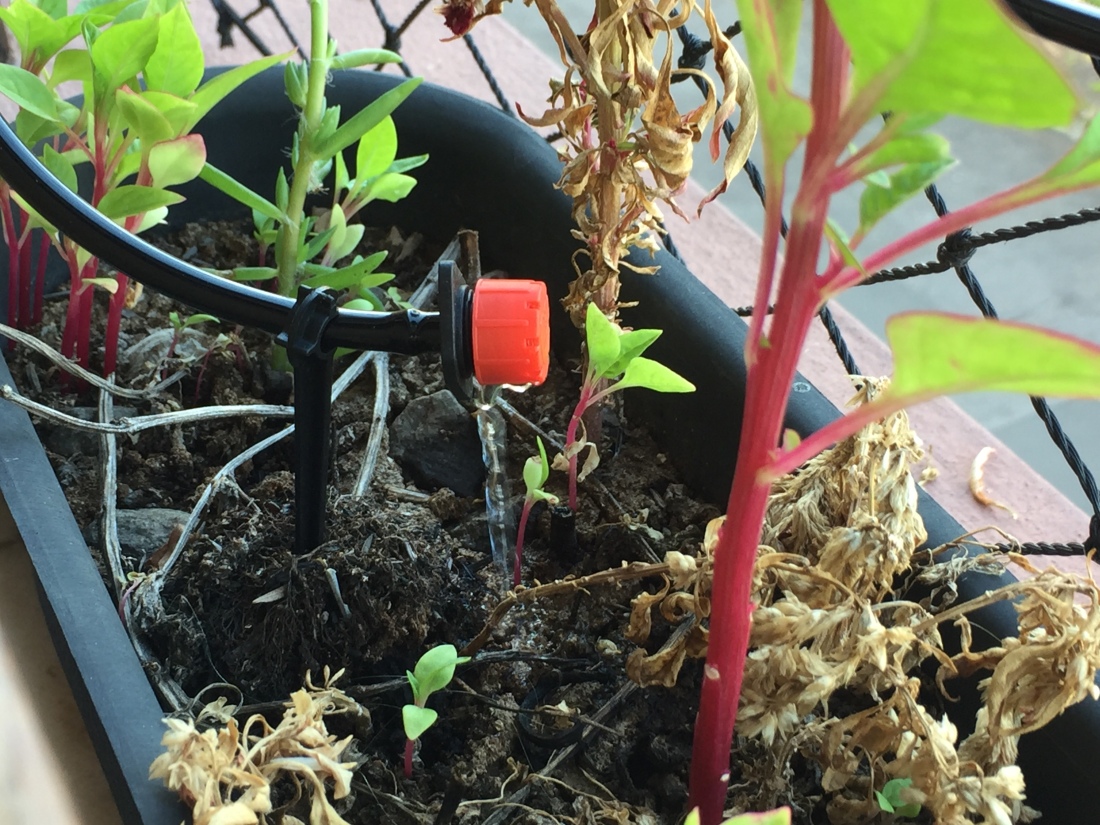
Water coming out of a dripper. This one is almost closed, for a small flow. On a larger pot, with the dripper wide open, you get more of a “shower” pattern – depending on water pressure.


LEDs as sensors: putting it to test

There was a workshop at SIGGRAPH 2018 titled LEDs as Sensors, and I was tipped to it via the hackaday post from 2018-08-21, “A LED you can blow out” (with no added sensor it said, which is technically true if you stick to the meaning of “added” in the title).

Basically, the gist of it is to just feed an LED some DC current and watch its forward voltage drop: it varies with temperature, so if after you let it warm up a bit you blow quickly on it, you should notice a sudden change in voltage. Connect that to an analog input on your micro-controller of choice, do some averaging to smooth-out noise, and that sudden change can be used as a trigger to “blow out” the LED.

Note that for any quick voltage change to be observed, there must be minimal thermal inertia around the LED junction.  This means that “normal” LEDs with big plastic casings don’t work for this purpose. The article suggests a tiny pre-wired SMD LED.  Since I wanted to test this out without ordering (and waiting) an LED, I’ve decided to search around the junk drawer; the best candidate I could find was a scrap of LED light strip which had exposed SMD LEDs soldered to the tape and an SMD resistor thrown in for every 3 LEDs. That’s what I tested with, and I’m happy to report that it (sort of) worked.

Some references and links to more info / materials


Figuring out the wiring on an LED strip segment

First things first, I needed to figure out how the LED light strip I had lying around is wired-up. This is not always easy to see by just looking at, as paint makes the conductive tracks barely discernible and a bit hard to identify:

Segment 1

However, shining a strong light underneath the strip did the trick of exposing the copper traces, and the wiring becomes evident:

Segment 2.jpg

It turns out that each segment is wired with three LEDs and one 150-ohm resistor in series, and each of the strip segments is connected in parallel to all others.

Isolating on LED and measuring it out

I’ve decided to use one of the LEDs on the strip segment and the series resistor for this test. This would require me to just solder the three leads – ground, VCC from a digital output and the voltage sensing for the ADC.  Here’s my beautiful sketch of a plan:

WhatsApp Image 2018-08-23 at 15.03.22.jpeg

Determining the LED voltage drop and dimensioning the series resistor

With the leads soldered, I’ve measured the forward voltage drop in the resistor, 2.6v.

A meter reading 2.63v as the forward drop on an LED, shown lit above the meter

Since the series resistor on the strip is 150-ohm, a quick calculation shows that if powered from 5v, the current I=V/R over the LED would be:  (5v – 2.6v) / 150R = 16mA.  This is ok from the standpoint of running this from a digital output pin on an Arduino, but a bit more than the 12mA in the original circuit;  I’ve figured it would work.

And it did!  I do need to blow hard and quick in order to trigger the action in the software (and I had to tweak the parameters in the code a bit, but in the end I did manage to consistently turn off this LED with a quick hard blow.


Mining catcoins – an energy view

Some friends put together an initiative for a cat rescue NGO: catcoins. The premisse is simple: you visit the site, agree to donate CPU time to the cause of helping stray cats, and the site will use your browser to mine a cryptocurrency for the NGO, while showing pictures of cats up for adoption, in the hopes of finding ’em a new home.

The idea is great, as it capitalizes on the current boom in cryptocurrencies, and brings visibility to the NGO, even if the actual monetary value from the mining activity is not that great.  From my part, I wanted to use this as an experiment to get an idea about the cost involved in the mining of this currency.

The experimental setup

I’ve used two rigs for testing this: a Raspberry Pi 3 (Quad Core 1.2GHz Broadcom BCM2837 64bit CPU) and an HP ZBook 15 laptop (Intel i7-4810MQ Quad Core 2.80 GHz). Both systems ran the mining in the Chrome browser – experimentally Firefox ran about 10-20% faster than Chrome, but the numbers below were all captured running on Chrome.

The results with the Raspberry Pi

Power usage idling:    2.4W
Power usage mining:    5.5W

Results from 10min mining:
- Calculations:        2796
- Performance:         4.66 calc/s
- Amount R$:           1.1486654161781946072684642438453e-4

If this setup ran continuously for 1 year (approx):
- Calculations:        146957760
- Amount accrued:      R$  6.04
- Electricity cost:    R$ 22.64

The results with the Intel-based laptop

Power usage idling:    88W (laptop, monitor, router)
Power usage mining:    135W (mining adds roughly 47W)

Results from 10min mining:
- Calculations:        25590
- Performance:         42.65 calc/s
- Amount R$:           0.0010513

If this setup ran continuously for 1 year (approx):
- Calculations:        1345010400
- Amount accrued:      R$  55.26
- Electricity cost:    R$ 555.82
- Electricity cost:    R$ 192.68 (just the added cost of mining)

Conclusions

  • Using the javascript interpreter on the browser to mine cryptocurrency is not cost effective, you spend more on electricity than you accrue in coin; and that is not factoring the cost of the equipment.
  • In fact, with the cost of electricity for consumers in Brazil, the cost ratio is almost 4:1
  • In terms of the amount of coin per KWh of electricity, the Raspberry Pi may be more efficient than the laptop; this is not possible to attest with certainty from this measurements as the Pi was running barebones and headless, and the notebook had two monitors, external keyboard and mice, and an access point, all powered from the same power outlet were the measurements were taken. A comparable setup would require measuring power just for the laptop and having its LCD off during the test.
  • Finally, 10 minutes is a rather small time window for this experiment, should we want results with a higher degree of confidence.

A man with one watch knows what time it is

There is a quote I always liked, by Lee Segall, which is actually known as Segall’s law – it seems like there’s a “law” made out of every witty saying.  It goes like this:

A man with one watch knows what time it is; a man with two watches is never quite sure.

I was duly reminded of it recently: having acquired four DHT22 humidity-and-temperature sensors, I set out to comparte them and see whether they report similar results out of the same environmental conditions.  The experimental setup was simple, a NodeMCU SoC with each DHT22 connected to its own GPIO pin (this sensor module does not implement a bus and thus each require its own dedicated I/O pin).  Readings were taken every 5 seconds and output to the serial port as CSV values (one reading per line).

20170810_091119.jpg

The results of collecting data for 15 minutes can be seen below. The first set of curves show the temperature, with starts out between 20.3 and 21.0 ºC (a disagreement of 0.7 ºC, or 3% between the sensors.


02 Temperature and humidity with air conditioning.png

The second set of curves, the humidity readings, appears more coherent, but that is a mere effect of the scale of the values being larger due to an overall larger excursion of the sampled data. The humidity starts out with the sensors reading between 66.9% and 77,5% – for a much larger 10.6% disagreement.

Overall during the 15min this test ran the maximum disagreement from the sensors on the temperature was a mild 1.1ºC, while the maximum difference in readings in the humidity was 13.1%

The drop in temperature and humidity displayed in the chart was induced by an ar-conditioned being turned on – it is interesting to note that the humidity drops at first, then start to climb back up after the temperature stabilized; this is an effect which I cannot explain, neither I can infer whether this was “real” or an artifact of the way the sensor works.  Empirically the air felt dryer, but I would not trust the feeling alone and I had no other sensors at hand.

Conclusion

  1. The humidity readings from the DHT22 cannot be trusted to be accurate; one is not going to make a weather station with these guys, not without some serious calibration with more accurate sensors
    1. However, the trend values were consistent – same rate of decline/climb; for the application I have in mind this is all I care about.
  2. Temperature is looking good: they all reported more or less the same values. I’m yet to check these readings against a different sensor module – I have a few DS18B20 modules, and these are fairly precise little things.